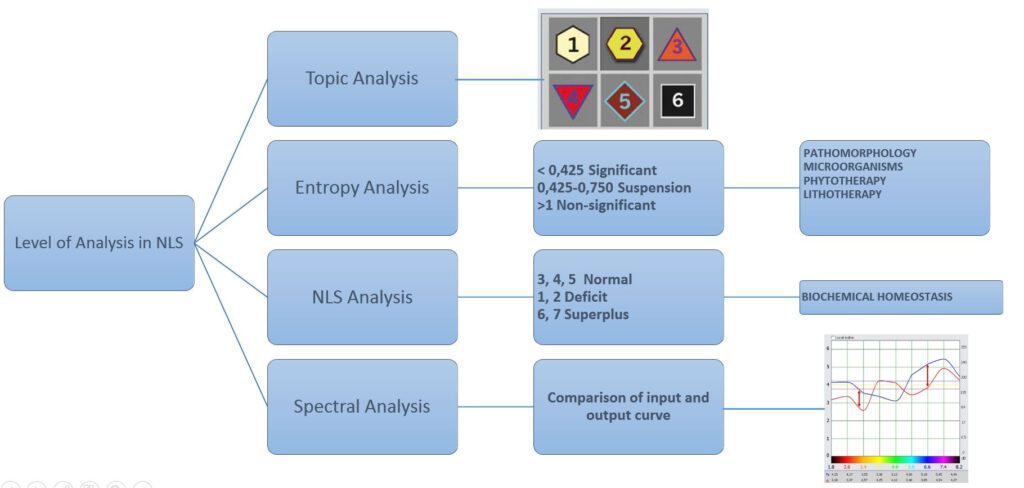
There are 4 different levels of analysis defined within most NLS systems.
Topic Analysis
The Topic Analysis is based on the Fleinder scale and exists out of 6 differentiated levels:
- The level of a latent functional activity.
- The level of balanced regulation.
- The shift of the characteristics to the higher level, stressed condition of regulatory systems
- Asthenia of regulatory systems
- Compensated failures of adaptation mechanisms.
- Decompensation of adaptation mechanisms, represented destruction.

Entropy Analysis
Several etalons use entropy analysis to indicate acuteness and significance:
- <0.425 quite acute and pronounced (shown brown)
- between 0.425 and 0.750 is relevant (shown red)
- >0.750 latent of not relevant (shown black)
NLS Analysis
NLS analysis is only used with the Biochemical Homeostasis etalon.
The E-values in the 3rd column are shown, when the Biochemical Homeostasis etalon is used
The e-values comprise the following values:
(-3, -2, -1, N, +1, +2, +3) in the 3rd column with values between 1 en 7.
In the example shown below we read -3(1), what means that the measured value is too low (-3) and possibly even lower (1): the biochemical index is lower than the range between -3 and +3. If range values were between -2 and +2 (2ᴖ6) we could assume a safe range. If the e-value showed +3(7), this would indicate that the biochemical index higher is in the stand
Spectral Analysis
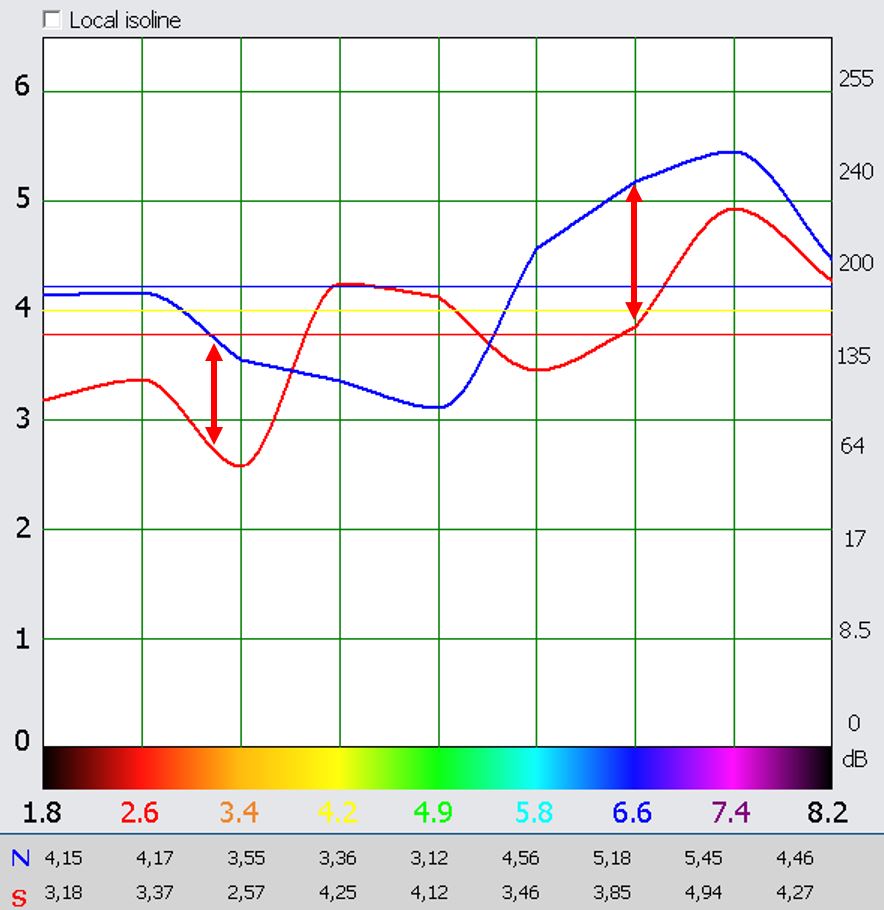
The spectral analysis covers the analysis of the curved diagrams.

The isolines, the distances between the isolines and the curves (dissociations) and the position of the blue and red isolines and the curves are used to evaluate the graphic. Most striking are the distances between the red and blue curves and the isoline.
Acute conditions tend to show large inter-curve distances (2 fields and more, >2 units). A large contiguous area with large spacings is also an indication. If the blue isoline is above the red one and at a small distance, the process is compensated. This means that the organism can probably regenerate the disturbance on its own. If the distance is greater than about half a field/box or the red line is at the top, the process is decompensated.
Regeneration is then unlikely or difficult without external help. If the blue and red curves do not overlap, this indicates a worse prognosis (only if the red curve is at the top!). The main isoline is mostly in the range of 2 – 4 units. Some acute illnesses tend to be below 3 units (the same applies here: there is no fixed rule!).
The pathological condition can be recognized more easily if a suitable organ frequency is compared with it . The system does this as a mathematical-statistical calculation with coefficients for the diagnostic recommendation.
A heart attack is one of the acute diseases and is decompensated.