Evaluation of RM etalons
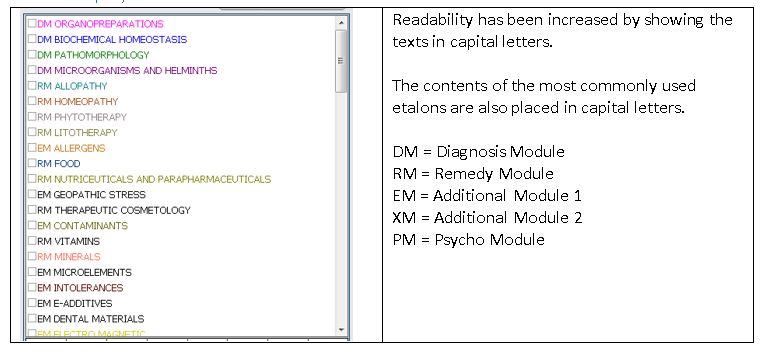
The RM (Remedy Module) components are listed as follows and use a deviating scale:
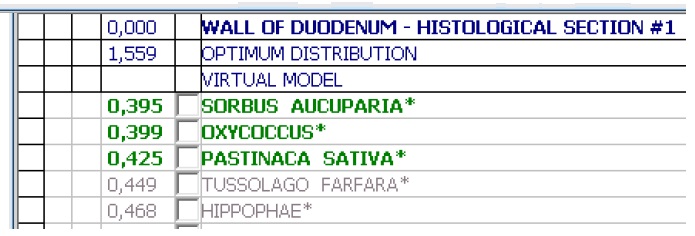
- <0.425 relevant (displayed in green)
- >0.435 not relevant (displayed in grey)
Evaluation of EM and XM etalons
- the EM (Evaluation Module) and XM (eXtra Module) etalons use a deviating scale as well:
- <0.425 quite acute and pronounced (shown brown)
- between 0.425 and 0.710 is relevant (shown red)
- >0.710 latent of not relevant (shown black)
Evaluation of PM etalons
- In these etalons, the emotional and psychological components are weighted with a different scale as well:
- <0.425 quite acute and pronounced (shown brown)
- between 0.425 and 0.710 is relevant (shown red)
- >0.710 latent of not relevant (shown black)
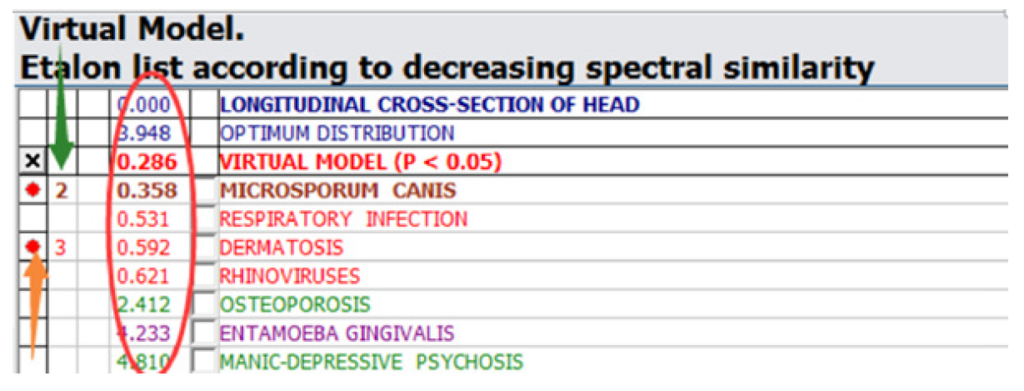
How to read the Virtual Model
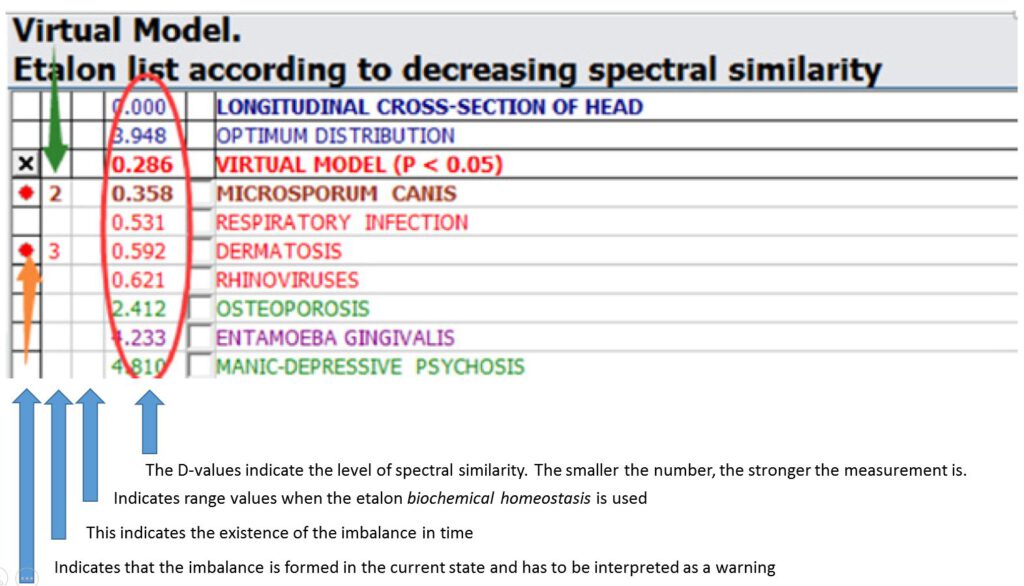
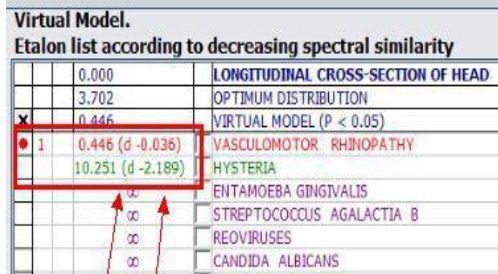
- Red dots in the 1st column (orange arrow)
Indicates that the unbalance is formed in the current state and has to be interpreted as a warning.
- Numbers in the 2nd column (green arrow)
You can get the following numbers: 1, 2, 3, 4, 5, 6, 7, 8, 9, ∞
This indicates the existence of the unbalance in time
a. (1-3) the unbalance originated recently
b. (4-5) the unbalance originated in the last 6 month
c. (6-7) the unbalance originated in the last 12 months (1 year)
d. (8-9) the unbalance originated in the last 2 years - E-values in the 3rd column (see picture below)
The E-values in the 3rd column are shown, when the etalon biochemical homeostasis is used.
The e-values comprise the following values:
(-3, -2, -1, N, +1, +2, +3) in the 3rd column with values between 1 en 7.
In the example shown below we read -3(1), what means that the measured value is too low (-3) and possibly even lower (1): the biochemical index is lower than the range between -3 and +3. If range values were between -2 and +2 (2ᴖ6) we could assume a safe range. If the e-value showed +3(7), this would indicate that the biochemical index higher is in the standard range. - D-values in the 4th column (round circle)
The D-values indicate the level of spectral similarity. How smaller the number, how stronger the measurement is.
a. <0.2 quiet acute and in some cases chronic (shown brown)
b. >0.8 latent of not relevant (shown purple)
c. Values between 0.2 and 0.8 are relevant (shown red)
d. A red dot in de 1st column indicates a trend towards a pathological disturbance
e. The higher the negative number behind d (d -0.036), the faster the disturbance is developing
You can find more information on the updates Hunter 4025 NLS database here.